December 3, 2024
Is buying gold the golden rule of investing? Has gold outperformed the S&P 500 in the last 28 years?
Surprisingly, over the past 28 years, from 1997 to 2024, gold and the S&P 500 have produced very similar returns. A dollar invested in the S&P 500 in January 1997 would be worth today about $8. The same $1 invested in gold in the same month would also be worth today about $8. Meanwhile that same $1 if left uninvested (under the mattress) would have lost about half of its value due to inflation (2.55% annual average).
Isn't that super interesting?
The S&P 500 is a sophisticatedly curated index comprised of what are considered to be the best 500 publicly traded companies in the United States. Gold is a piece of metal. The S&P is led by the fanciest technology companies and the top economic players on every segment of the economy. Gold is a piece of metal. The S&P 500 relies on the expertise of thousands of financial experts, sophisticated executives, and investment bankers. Gold is a piece of metal.
It's amazing that a piece of metal can produce similar (slightly better) results than the S&P 500. That should tell you how subjective market valuation is in general and how ridiculously funny the investment world is.
Should invest in gold rather than in the S&P 500?
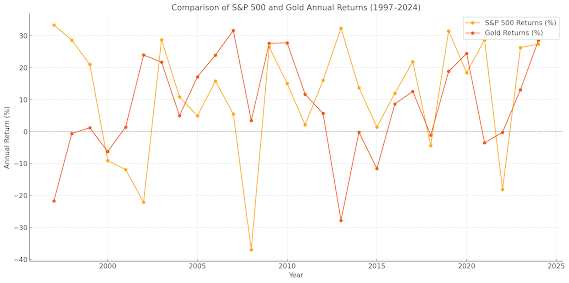
No. The golden rule of investing is diversification. You should invest in gold in addition to investing in the S&P 500. You should invest in both. As you will see below, in any given year, the S&P 500 can outperform gold and vice versa. The two assets do not always move in the same direction. Noting how well both gold and the S&P 500 have performed over the years, you should consider investing in both. The amounts and allocations are up to you. However, a 50/50 approach is not as crazy as it sounds considering the actual data.
Overall Returns of the S&P 500 and Gold from 1997 – 2024:
Year S&P 500 Return (%) Gold Return (%) Winner2024 27.35 28.52 Gold
2023 26.29 13.08 S&P 500
2022 -18.11 -0.23 Gold
2021 28.71 -3.51 S&P 500
2020 18.40 24.43 Gold
2019 31.49 18.83 S&P 500
2018 -4.38 -1.15 Gold
2017 21.83 12.57 S&P 500
2016 11.96 8.63 S&P 500
2015 1.38 -11.59 S&P 500
2014 13.69 -0.19 S&P 500
2013 32.39 -27.79 S&P 500
2012 16.00 5.68 S&P 500
2011 2.11 11.65 Gold
2010 15.06 27.74 Gold
2009 26.46 27.63 Gold
2008 -37.00 3.41 Gold
2007 5.49 31.59 Gold
2006 15.79 23.92 Gold
2005 4.91 17.12 Gold
2004 10.88 4.97 S&P 500
2003 28.68 21.74 S&P 500
2002 -22.10 23.96 Gold
2001 -11.89 1.41 Gold
2000 -9.10 -6.26 Gold
1999 21.04 1.18 S&P 500
1998 28.58 -0.61 S&P 500
1997 33.36 -21.74 S&P 500
Gold outperformed the S&P in 14 years out of the last 28 years. The reverse is also true. The S&P 500 outperformed gold in 14 years out of the last 28 years.
The S&P 500 has delivered substantial returns, with notable annual performances such as 33.36% in 1997, 28.58% in 1998, and 32.39% in 2013. However, in 2008 the S&P 500 had -37% return and in 2002 it had a -22.10% return.
Gold: Gold's performance has been varied, with significant gains like 31.59% in 2007 and 27.74% in 2010, as well as declines such as -27.79% in 2013, and -21.74% in 1997.
Volatility: The S&P 500 exhibited higher volatility, with significant fluctuations during economic cycles, including the dot-com bubble, the 2008 financial crisis, and the COVID-19 pandemic. Gold often acted as a safe-haven asset, with increased demand during economic downturns, such as in 2008 when it provided a positive return despite the S&P 500's decline.
While both assets have appreciated over the past 28 years, gold has outperformed the S&P 500 in terms of cumulative returns. However, the S&P 500 has offered substantial growth relative to gold during booming and bubbly years of economic expansions. You should consider these dynamics when making investment decisions, balancing potential returns with associated risks.
Of course, the future has not been created yet. Whatever happened in the past does not control what will be made in the future by humans and other factors.
There's a tale of this Indian grandmother who beat her grandson's investment strategy by simply buying gold instead of investing in the S&P 500 as he passionately recommended. We believe it. Gold is very popular in India and older generations are often wise in their traditional approaches. As the financial figures show, investing in gold has provided impressive returns in the last 28 years, slightly outperforming the "king" index, the S&P 500 from 1997 through 2024.
Now you know it.
Creatix is a commercial information matrix. A matrix a place or platform where things are created. To create is to transform. The vision of Creatix is simple: everyone needs information and intelligence. The business mission of Creatix is to transform general information into commercial intelligence. Find us on the web at www.creatix.one

Comments
Post a Comment